


Gold prices over the past decade have reflected shifts in global monetary policy, geopolitical risk, inflation cycles, and investor demand for safe-haven assets. The 10-year trend captures multiple economic phases, including pandemic-era volatility, aggressive interest rate tightening, and renewed central bank gold purchases. Understanding this timeline provides context for how gold reacts to macroeconomic stress and financial market transitions.
10-Year Gold Price Overview
Between 2016 and 2026, gold moved through several distinct cycles marked by rallies, consolidations, and corrections. Prices responded closely to inflation expectations, real interest rates, and currency fluctuations.
Gold Price Performance Snapshot
| Year | Approx. Average Price (USD/oz) | Market Phase |
|---|---|---|
| 2016 | 1,250 | Recovery rally |
| 2017 | 1,260 | Consolidation |
| 2018 | 1,270 | Range-bound |
| 2019 | 1,390 | Breakout year |
| 2020 | 1,770 | Pandemic surge |
| 2021 | 1,800 | Volatile plateau |
| 2022 | 1,800 | Inflation hedge demand |
| 2023 | 1,940 | Central bank buying |
| 2024 | 2,050 | Record highs |
| 2025 | 2,100+ | Structural uptrend |
Prices represent rounded annual averages based on international spot benchmarks tracked by the World Gold Council.
Major Trend Phases
2016 to 2018: Stabilization After Commodity Weakness
Following a multi-year commodity downturn, gold entered a stabilization phase. Investor positioning shifted toward defensive assets amid political uncertainty and moderate inflation concerns. Prices remained range-bound but gradually strengthened.
2019 to 2020: Safe-Haven Surge


Gold rallied sharply in 2019 and accelerated in 2020 during the global pandemic. Central bank stimulus programs and near-zero interest rates reduced the opportunity cost of holding non-yielding assets. In August 2020, gold reached a then-record high above 2,000 USD per ounce.
2021 to 2022: Inflation and Rate Cycle Conflict
Rising inflation increased demand for inflation hedges, but aggressive monetary tightening by the Federal Reserve strengthened the US dollar and pressured precious metals. This created a volatile sideways market where gold traded within a wide range.
2023 to 2025: Structural Demand Shift
Central bank reserve diversification and persistent geopolitical tensions contributed to renewed long-term buying. Several economies increased gold reserves to reduce dependence on foreign currencies. This structural demand coincided with new nominal price highs.
Key Market Events That Influenced Gold
Global Pandemic Monetary Expansion
Emergency stimulus programs injected liquidity into financial systems worldwide. Real yields turned negative, historically a supportive condition for gold.
Inflation Surge Across Major Economies
Consumer price inflation reached multi-decade highs in several countries. Gold functioned as a portfolio hedge during periods of currency purchasing power erosion.
Central Bank Reserve Strategy Changes
Record levels of sovereign gold purchases were reported during 2022–2024. Reserve managers increased allocations to diversify currency exposure.
Interest Rate Tightening Cycle
Rapid rate increases strengthened major currencies and temporarily reduced gold momentum. However, elevated debt levels kept long-term demand intact.
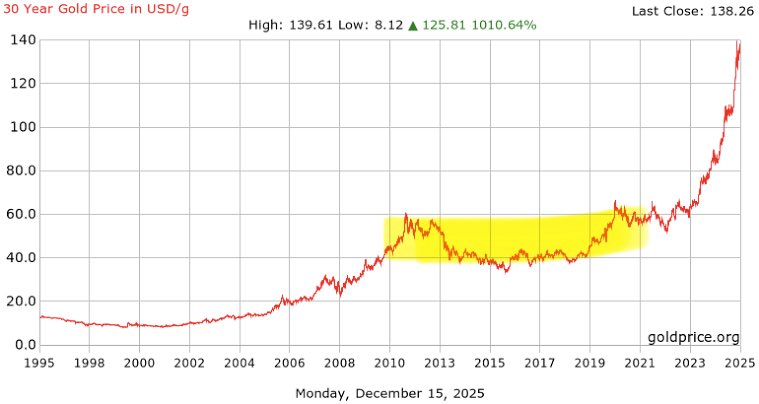
10-Year Gold Price Trend Visualization
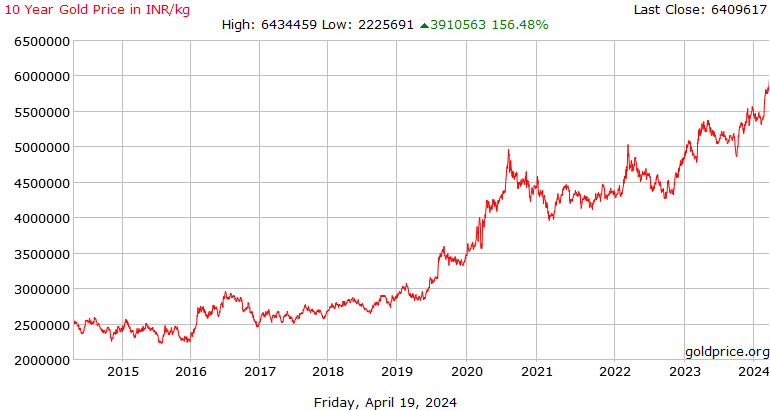


The long-term chart illustrates a gradual upward slope interrupted by macroeconomic shocks. Each correction phase corresponded with shifts in real yields and currency strength.
Market Drivers Behind the Decade Trend
Monetary Policy Sensitivity
Gold prices showed consistent correlation with real interest rates. Lower yields supported rallies, while tightening cycles triggered corrections.
Currency Movements
A stronger US dollar often pressured gold. Conversely, dollar weakness historically aligned with price appreciation.
Geopolitical Risk Premium
Periods of conflict, trade disputes, and financial instability increased safe-haven flows into bullion markets.
Institutional Demand
Exchange-traded fund flows and central bank accumulation played a larger role in price formation than retail speculation.
Frequently Asked Questions
How much has gold increased in the last 10 years?
Gold roughly doubled in nominal terms over the decade, rising from near 1,100–1,200 USD levels in the mid-2010s to above 2,000 USD in the mid-2020s.
What year saw the biggest gold rally?
2020 recorded the most rapid acceleration, driven by pandemic stimulus and financial market uncertainty.
Why do central banks buy gold?
Central banks use gold as a reserve asset to diversify currency holdings, reduce exposure to sovereign debt, and strengthen balance sheet stability.
Does inflation always push gold higher?
Gold historically performs well during sustained inflation periods, but short-term price movement depends on interest rates and currency strength.
Final Verdict
The 10-year gold price history reflects the asset’s sensitivity to global monetary conditions, inflation cycles, and institutional reserve strategies. While short-term volatility emerged during tightening phases, long-term structural demand supported an upward trajectory shaped by macroeconomic transitions and financial system stress.


Post a Comment