
Price action trading systems are receiving renewed attention in global currency markets as traders increasingly rely on chart-based decision frameworks that focus on raw market movement rather than indicator-heavy models. The approach emphasizes direct interpretation of price structure, volatility, and liquidity behavior. Its growing visibility reflects broader shifts toward transparency and simplicity in technical trading methodologies.
What Defines a Price Action Trading System
A price action trading system is a rules-based framework that analyzes historical and real-time price movement without depending heavily on lagging indicators. The system interprets market structure through candlestick behavior, support and resistance levels, trend dynamics, and breakout patterns.
Price action methods are used across retail and institutional trading environments because they rely on universally available chart data. The approach is adaptable to multiple timeframes, from intraday execution to longer-term swing strategies.
Core components typically include:
| Component | Function |
|---|---|
| Market structure | Identifies higher highs, lower lows, and trend direction |
| Support and resistance | Defines key liquidity zones |
| Candlestick behavior | Reveals momentum and rejection patterns |
| Breakout structure | Signals expansion from consolidation |
| Risk framework | Establishes stop-loss and position sizing rules |
Structural Logic Behind Price Movement


Price action systems interpret the market as a sequence of auction cycles driven by supply and demand. Movement occurs when liquidity imbalances push price beyond established equilibrium zones.
Key structural principles include:
Trend Formation
Trends are identified through sequential highs and lows. A bullish trend shows consistent higher lows, while a bearish trend prints lower highs. Structural breaks often indicate potential reversals.
Consolidation Phases
Sideways ranges signal equilibrium between buyers and sellers. Breakouts from consolidation frequently lead to volatility expansion.
Liquidity Interaction
Markets tend to revisit high-volume zones where prior transactions occurred. These areas often become decision points for continuation or rejection.
Common Price Action Patterns


Price action trading systems rely on repeatable behavioral patterns that represent shifts in order flow. These patterns are interpreted within the broader market context rather than in isolation.
Frequently observed formations include:
| Pattern | Interpretation |
|---|---|
| Pin bar rejection | Strong defense of a price level |
| Engulfing candle | Momentum shift |
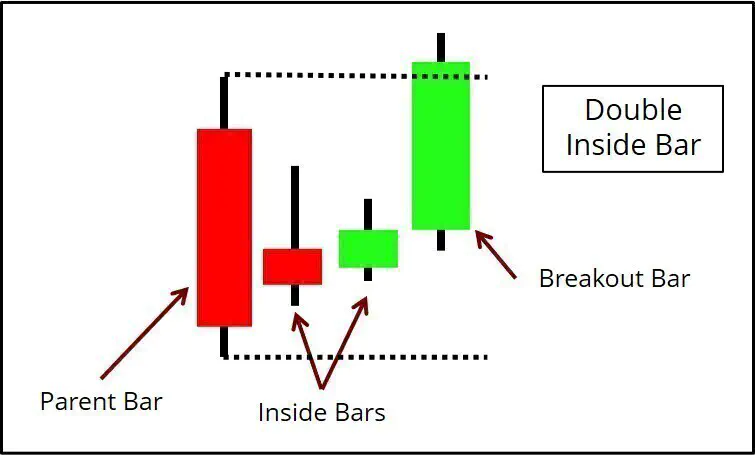
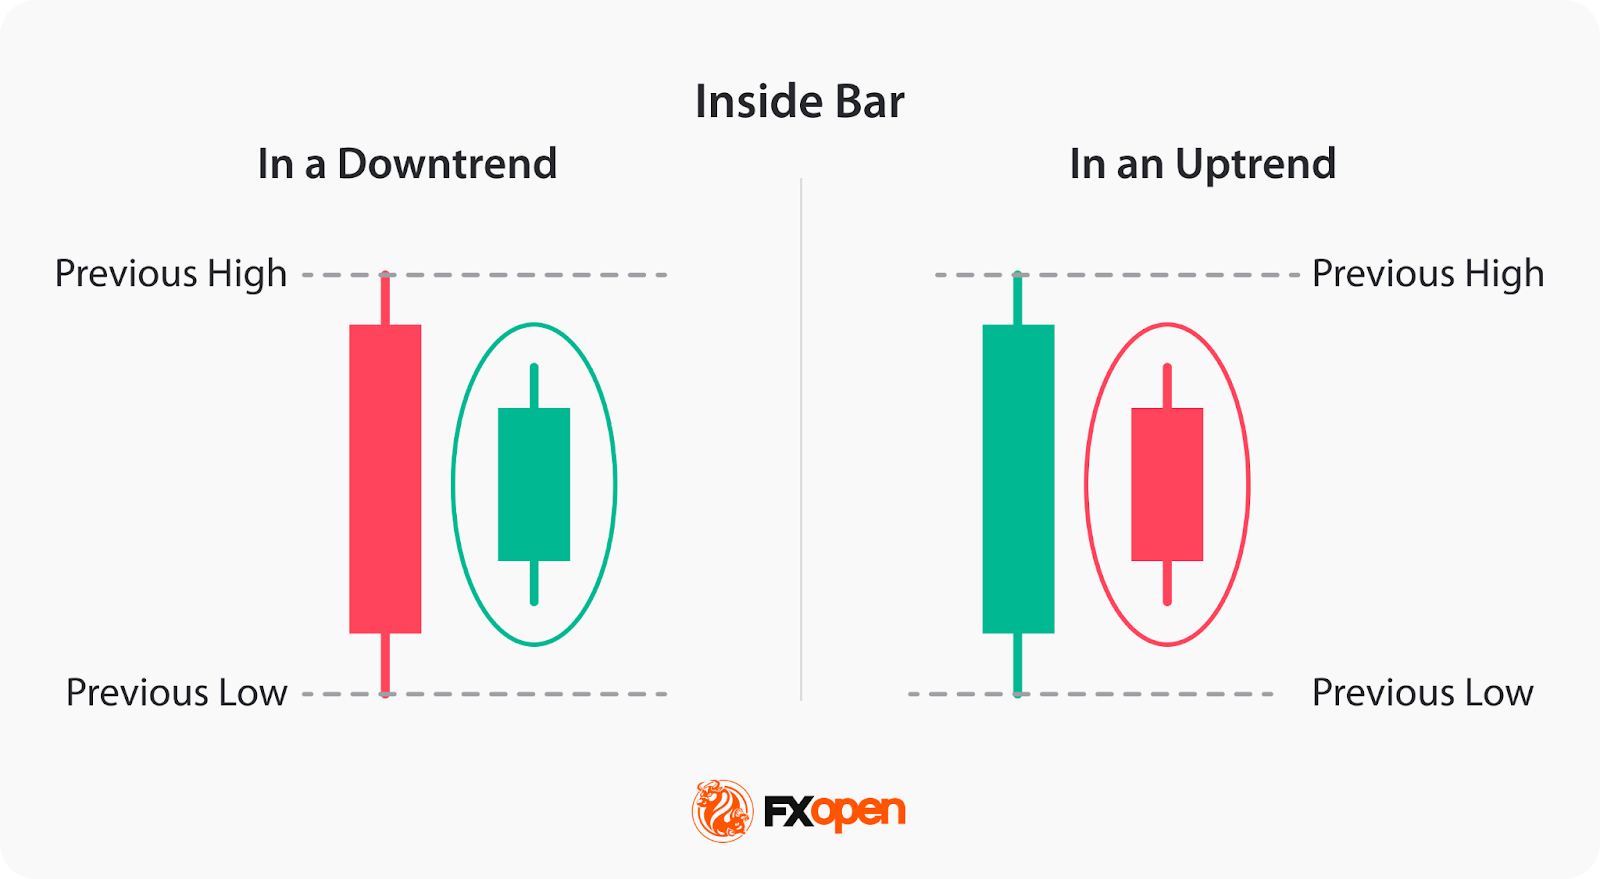
| Inside bar | Volatility compression |
| Breakout retest | Confirmation of structural change |
| False breakout | Liquidity trap and reversal |
Institutional and Retail Adoption
Modern trading platforms such as MetaTrader 4 and MetaTrader 5 have expanded access to clean chart environments that support price action analysis. These platforms allow traders to remove indicator overlays and focus exclusively on raw price behavior.
Institutional desks often integrate price action principles into algorithmic frameworks, particularly in volatility-based execution strategies. Retail traders use similar frameworks manually, emphasizing discretionary interpretation of structure.
The appeal lies in universality. Price charts reflect the same underlying market across all participants, creating a shared analytical reference.
Risk Management Framework
Price action systems typically embed risk management directly into structural analysis. Stop-loss placement is aligned with invalidation of the trade premise rather than arbitrary distance.
Key characteristics include:
| Risk Principle | Structural Basis |
|---|---|
| Stop-loss placement | Beyond structural swing point |
| Position sizing | Based on volatility and account exposure |
| Trade invalidation | Break of market structure |
| Reward targeting | Prior liquidity zones |
This structural alignment reduces dependency on predictive modeling and instead ties risk to observable market behavior.
Market Transparency and Analytical Simplicity
Price action systems are often associated with analytical transparency. Because the framework relies on visible chart structure, the decision process remains auditable and repeatable.
This transparency has contributed to adoption in educational environments, proprietary trading firms, and independent research communities. The system’s simplicity does not imply reduced sophistication; rather, it prioritizes clarity in interpreting market behavior.
Frequently Asked Questions
What markets use price action trading systems
Price action frameworks are applied in forex, equities, commodities, and cryptocurrency markets. The methodology is adaptable to any liquid market with consistent price data.
Does price action trading require indicators
Indicators are optional. Some traders combine price action with volatility or trend filters, but the core system relies on raw price movement.
Is price action trading automated
Price action principles can be programmed into algorithmic systems, though many practitioners execute trades manually based on discretionary interpretation.
What timeframe is used in price action trading
The system is timeframe-neutral. Traders apply the same structural logic on short-term charts and longer-term swing charts.
Final Verdict
Price action trading systems represent a structural approach to forex analysis built on observable market behavior rather than indicator-driven forecasting. The framework focuses on trend structure, liquidity zones, and behavioral patterns to guide execution. Its adoption across institutional and retail environments reflects demand for transparent, repeatable analytical models grounded in price movement alone.


Post a Comment